Home About us Contact us Protuner Loop Analyser & Tuner Educational PDFs Loop Signatures Case Histories
Michael Brown Control Engineering CC
Practical Process Control Training & Loop Optimisation
LOOP SIGNATURE 19
NOISE – NUISANCE OR ENEMY?
This Loop Signature series of articles would not be complete without sections on the problems of noise and filtering which are two of the most misunderstood areas in process control.
For the purpose of this discussion, noise can be defined as a random variation in the PV (process variable) signal around a mean level. There can be various causes for this, but generally it is caused by the process itself or by the measuring method. Typically noise in flows may be caused by turbulence, and in tank levels by ripples and disturbances on the surface of the liquid in the tank.
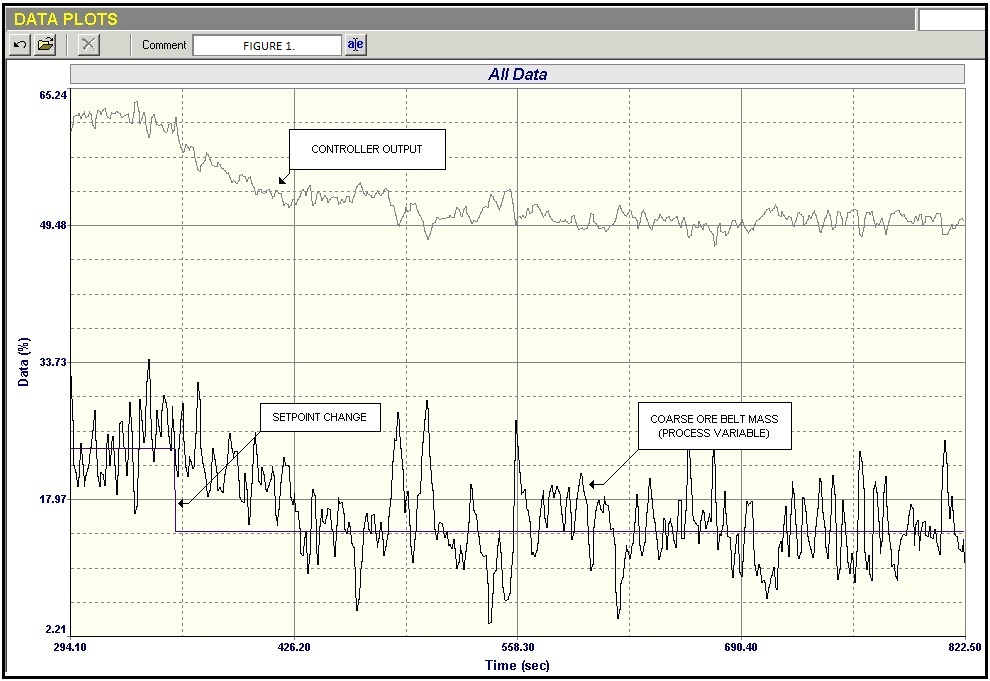
Figure 1 shows a portion of a closed loop test on a coarse ore feed conveyor belt. It can be seen that the signal coming in from the weightometer is extremely noisy. The amplitude of the noise is approximately 25%, and the noise, when put through a spectrum analyser displays more the characteristics of white noise, and does not show any significant individual harmonic frequencies. The noise in this case is mostly caused by the different sizes of rocks passing over the weightometer.
Figure 1.
Secondly the noise can create problems amongst the human beings who are using the control system, like operators, process people, and control and instrument personnel.
Generally the more serious of the two problems is the latter - the effect of noise on humans!
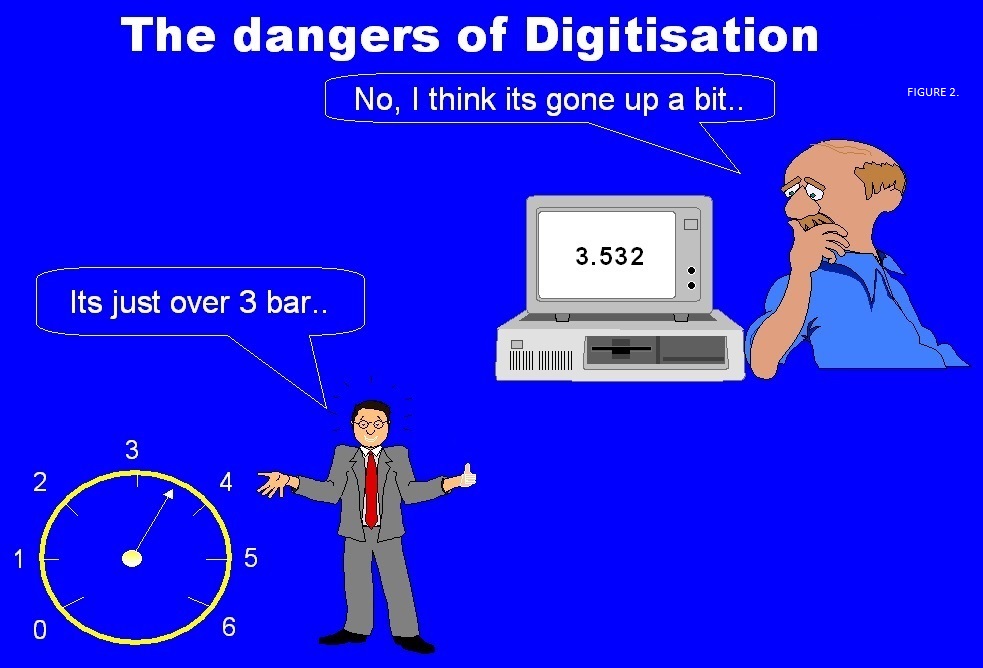
To understand what I am getting at, refer to Figure 2, which shows two people in the plant looking at a pressure reading. The operator is looking at a digital signal on his screen, and sees the pressure as 3.532 bars. The other man is out in the plant looking at the pressure on the dial of a pressure gauge. He sees the position of the needle on the scale relative to the range, and also that the pressure is about 3.5 bars.
The operator reading the digital signal, is completely reliant on the actual value displayed. He has no reference to a relative value, and has no immediate idea if the value is high or low, whereas the person looking at the gauge can immediately see roughly what and “where” the value is.
For control purposes on most loops, one is not too worried about absolute accurate values. It is generally more important that the process be kept at the setpoint value. In the old days of analogue instruments, operators often used to make a mark with a pen on the PV scale on the controller at the value at where they wanted the PV to be controlled. You normally are not interested in controlling to 3 decimal places, and even with the best control in the world, your PV on most industrial processes is always jumping around a certain amount due to noise and minor load variations going on in the process.
With noisy signals one has a much better idea of where your measurement is, by reading the information on an analogue indicator, or even better on a trend display or recording. If you try to view it on a digital indicator all you see are numbers jumping around and you have little idea of what is actually happening.
Figure 3.
In pre-digital days, it was difficult, and also expensive to filter signals, particularly with longer time constants, and people accepted noisy displays quite happily. However in modern times, digital technology allows one to write filters into the software very easily. It only takes a few lines of code. Furthermore the time constant of the filters can be set to any number you please, even hours. One of the first thing people now often do when programming digital control systems, is to suppress the noise by putting large filters onto the PV signal.
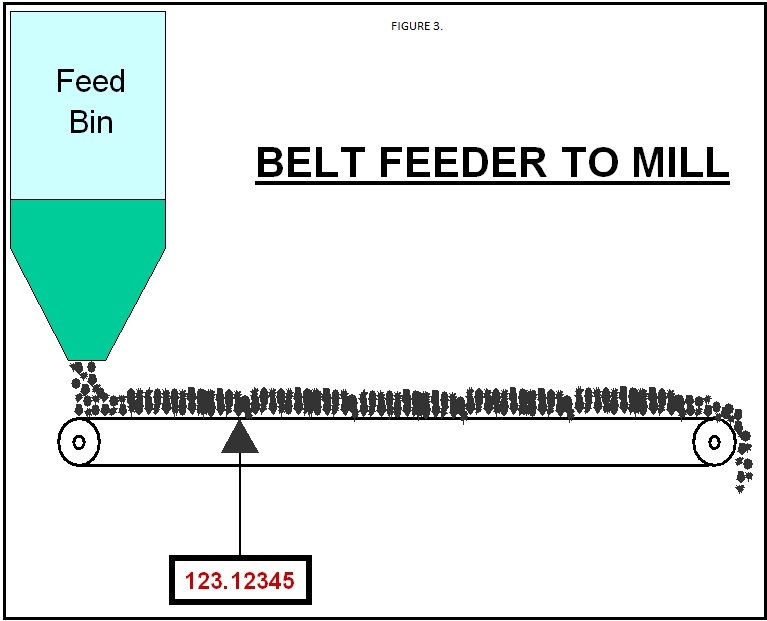
To illustrate these points with a real example, refer to Figure 3. This is a portion of a SCADA display showing the feed control to a milling system on a mine. There is a weightometer on the belt calibrated 0- 200 tonnes. The accuracy of this instrument would be at best ±1% FS, which equates to ±2 tonnes. However the person who drew the SCADA screen shows 5 numerals after the decimal point, which is ridiculous. However the Operator will believe the figure absolutely.
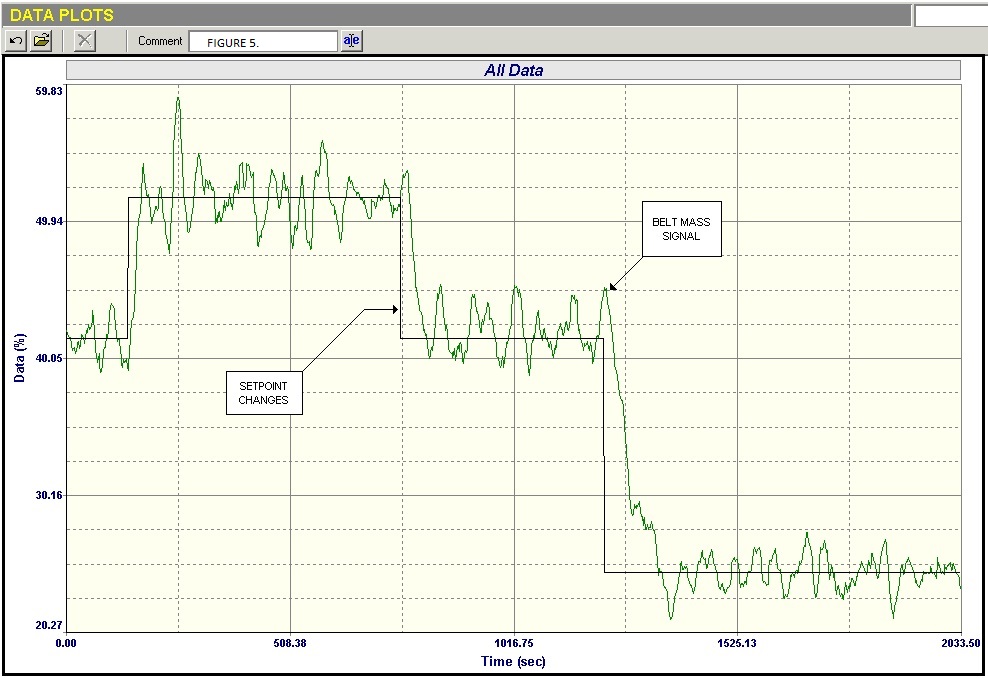
Figure 4.
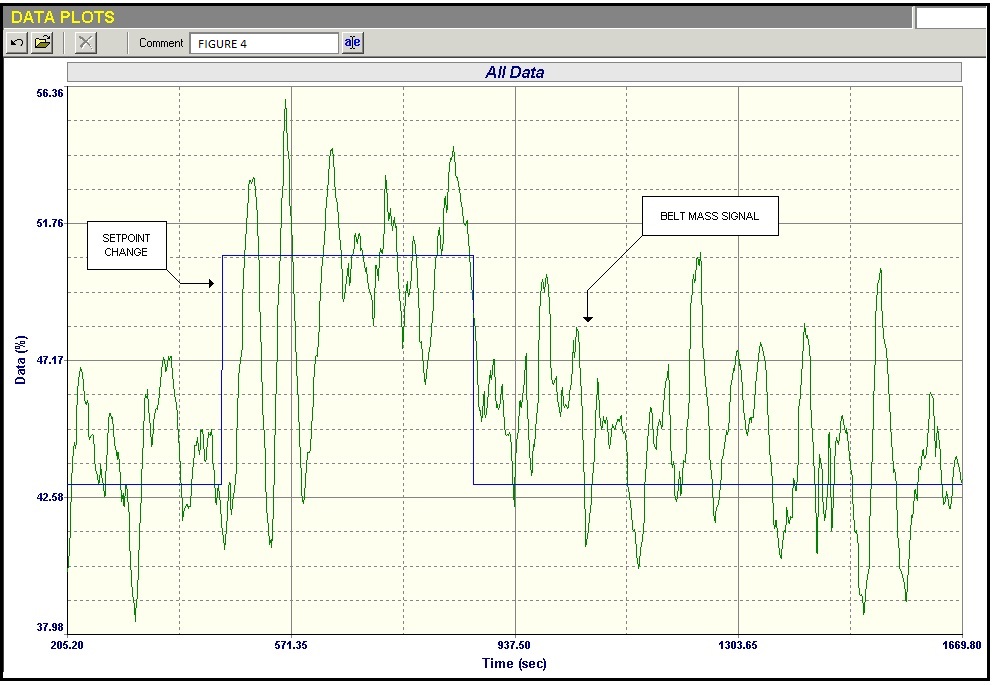
As very often the case on feed conveyors, the loop was extremely badly tuned. Figure 4 shows the closed loop “as-found” test with the existing tuning parameters. When a 10% setpoint change was made in the positive direction, it can be clearly seen that the response was almost unstable. When the setpoint was stepped back to the original value, it can be seen how long it took to get the process right back to setpoint. Please note that this recording was made with the Protuner analyser connected upstream of the filters, so the true mass signal is seen. (In the next loop signature article I will show you what the Operator will see on changes with big filters).
The important thing here is that the quality of the control can be clearly judged using the trends, but it would be impossible to do the same using the digital display.
I worked with the Operator when this work was performed, and explained to him that he must judge control on trends, and not on digital displays. He understood the reasoning, and was quite happy, particularly as it was the very first time they were able to run the milling system in automatic. Unfortunately he didn’t pass this information onto the night operator, who when he switched to the milling screen immediately saw the mass jumping all over the place. What does this mean to an uninformed person who is used to filtered signals? He thinks the control has gone unstable. What does he do then? He puts it into manual, as he knows this is the best way to stop a loop cycling. In this case, to his horror the signal still kept jumping around. He then tripped the plant and called out all the relevant people.
This is in fact one of my biggest problems. I spend a lot of time in plants removing filters and improving the controls. However although I explain the reasoning to the people I work with at the time, they generally do not pass this information on, and there are always complaints later on that the control was much better before, and it is now worse and quite unstable, as the process people do not understand the difference between instability and noise.
As will be shown in the next loop signature article, filters can in fact completely distort the information being viewed by the Operator, and in reality are generally undesirable. It therefore becomes extremely important that Operation personnel receive proper training about the effects of noise and filtering.